Working with Power BI Service
Power BI Service vs. Desktop
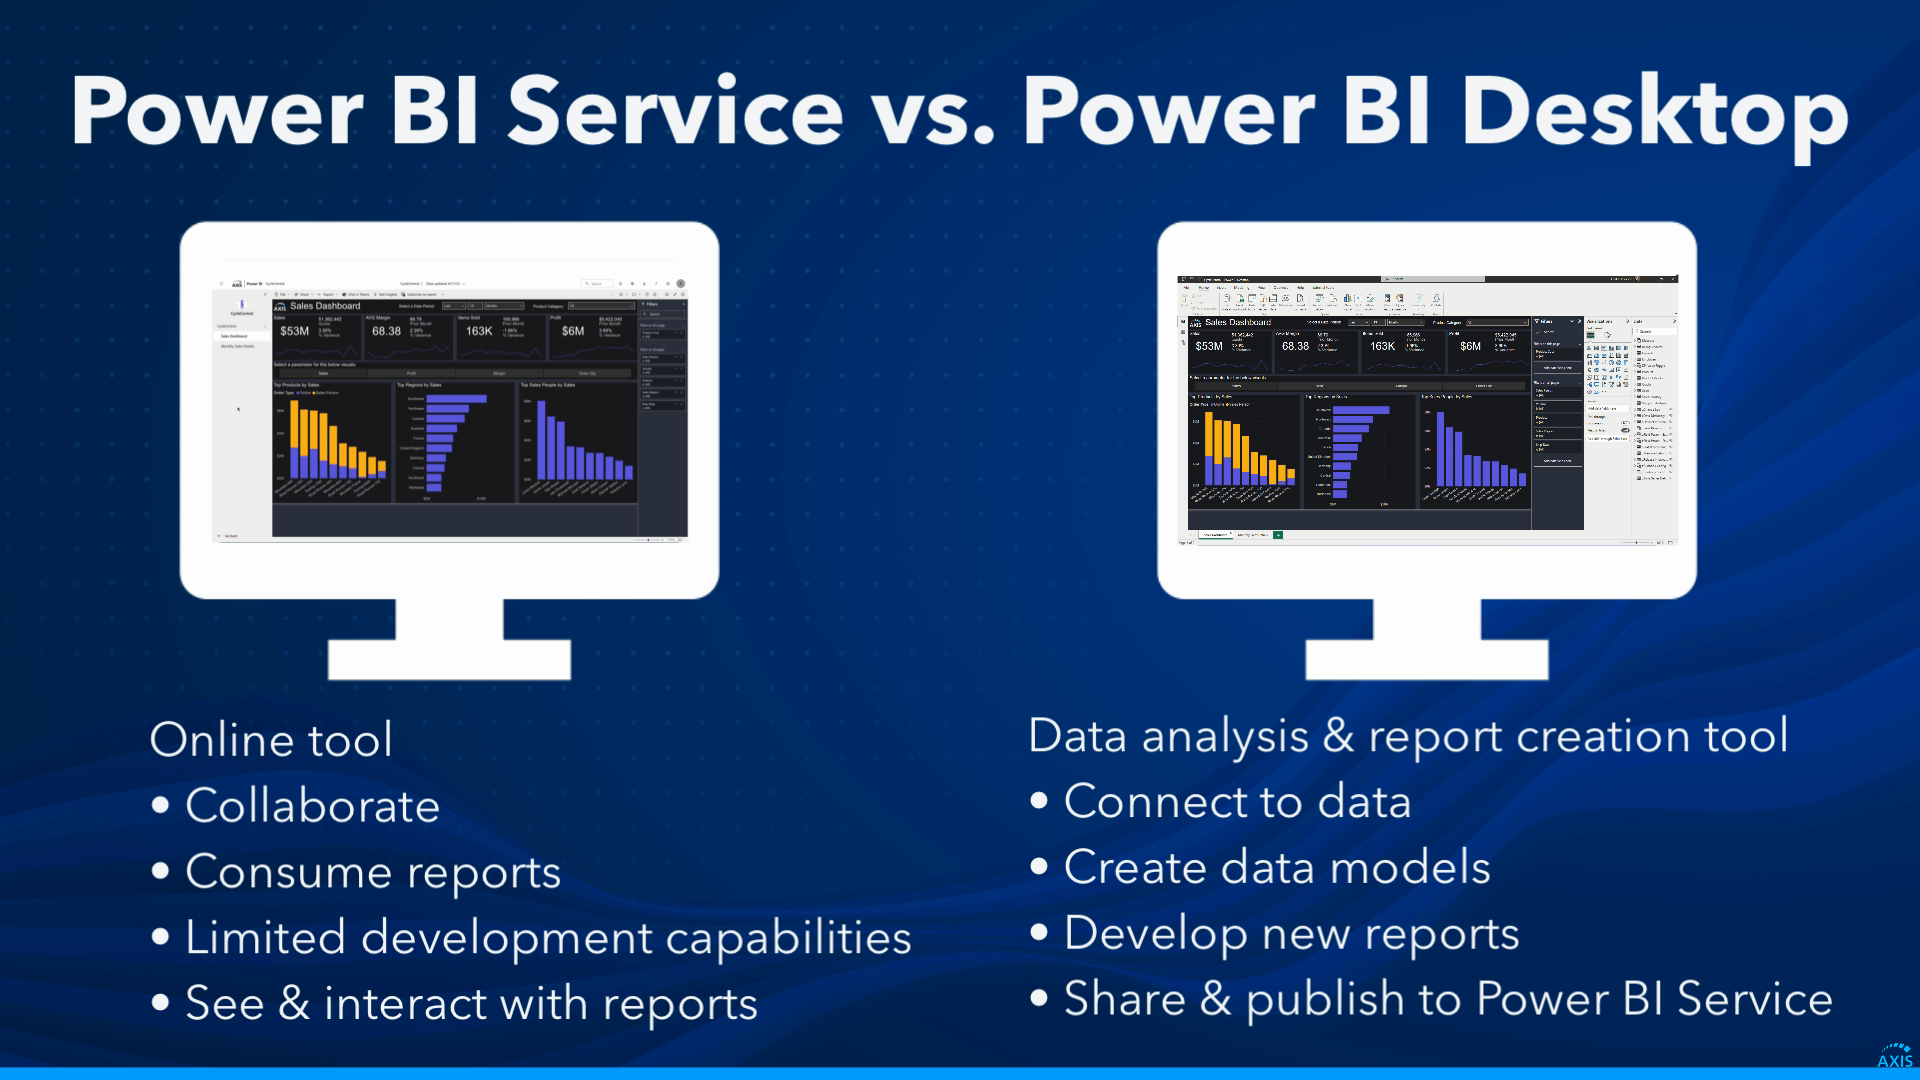
Power BI Service: A cloud-based application you access online. Power BI Service is designed more for collaboration and report consumption, than development. There are basic editing and report creation functions on Service, but it doesn’t have the same deep development features and functionalities that Power BI Desktop does.
Power BI Desktop: A more traditional Windows application for data modeling, analysis, and report creation that lets you connect to and transform data, create data relationships, and develop new reports based on those models. You can then share those reports with others by publishing them to Power BI Service online.
*Note: Power BI is updated every few months. The videos and images in these pages have been recorded using the version released in March 2023, so you may see slight modifications to your interface.
Key vocabulary
| Term | Description | Power BI Service or Desktop? |
|---|---|---|
| Report | A multi-page collection of visualizations that present detailed data insights. | Both Service and Desktop |
| Dashboard | A single-page canvas that serves as a summarized view of key metrics across multiple reports. | Service only |
| Application | A bundled reporting solution consisting of multiple reports, dashboards, and data within a workspace. | Service only |
| Workspace | A collaborative environment (similar to a folder) where you can view and share the content within, between users. | Service only |
| Dataset | Collections of data tables from different sources. Used to consolidate, transform, and create relationships between data elements. | Desktop only |
| Dataflow | A data preparation and transformation capability that uses a defined ETL process. Can be shared across multiple reports and datasets, ensuring consistency throughout data, reducing the need for duplication. | Service only |
Home Screen
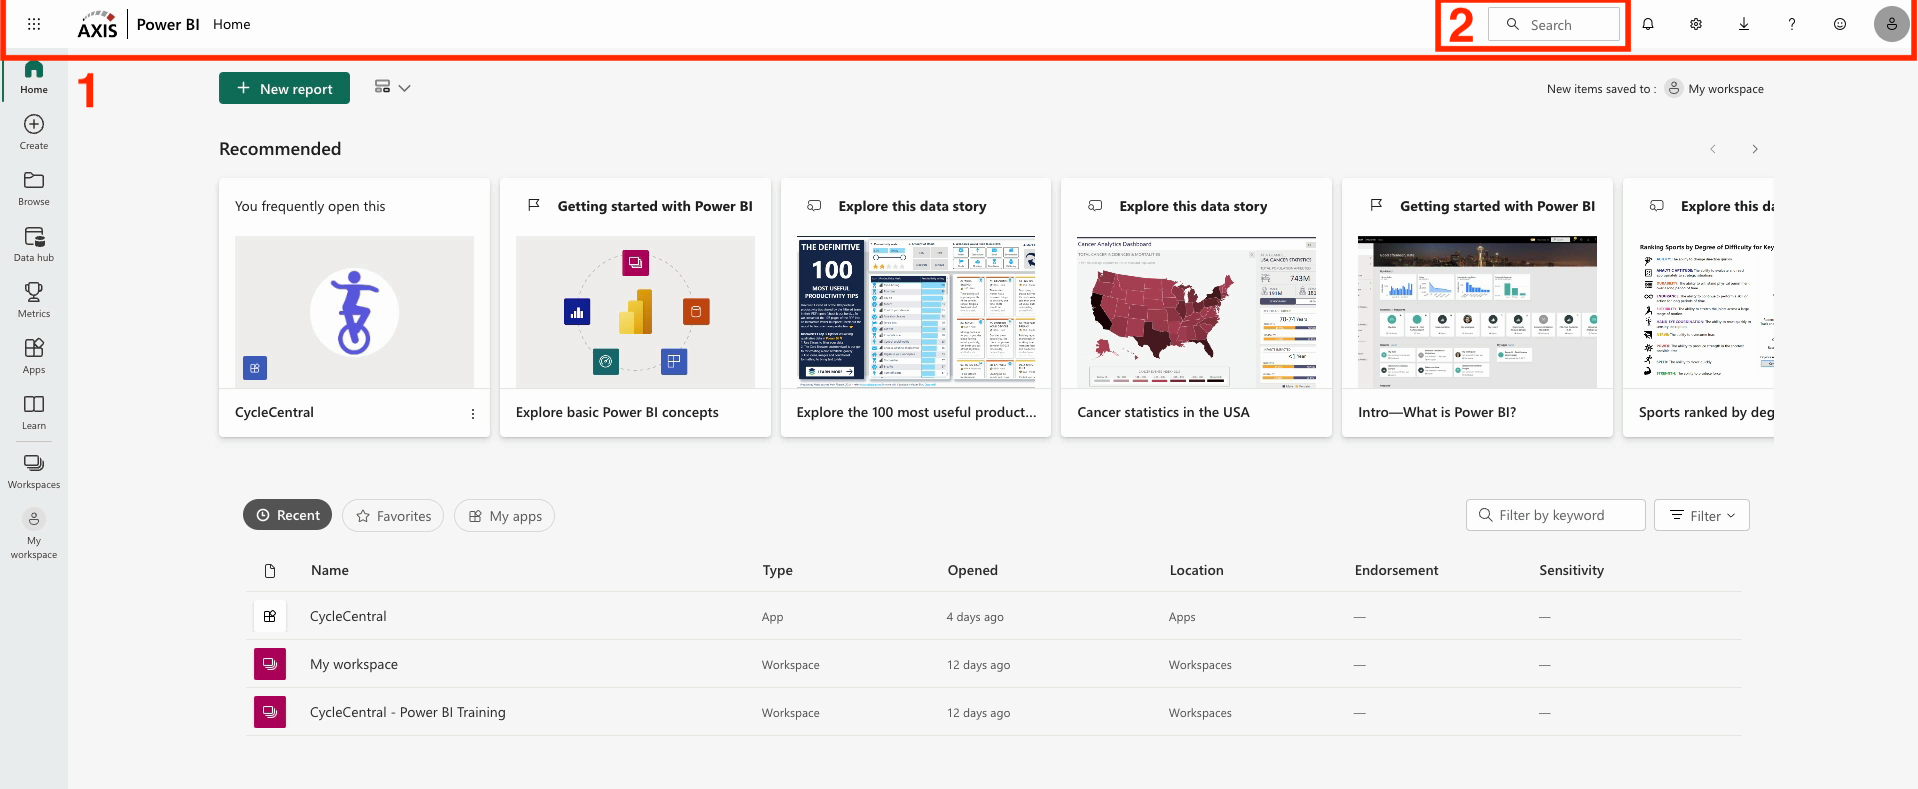
Two things you will always see as you navigate Power BI Service are the Service Banner and the Search Box.
1 - Service Banner: Addresses general Power BI service settings like notifications and access to your profile
2 - Search Box: This lets you search for Power BI content by name
*Note that the search box does not search the specific contents of Power BI content you've opened
Other Service Tools
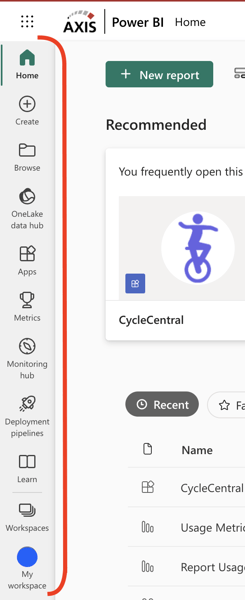
This list of tools may look different depending on the security your organization has established.
- Create: create reports, dashboards, datasets, paginated reports, etc. using the data available to you
- Browse: explore and discover content shared within your organization or workspace(s)
- Onelake Data Hub: provides a centralized view and management of data across various data sources across Power Bl Service
- Apps: displays a list of Power BI apps available to you
- Metrics: a centralized location to view and manage defined KPIs across different reports and dashboards
- Monitoring Hub: monitor and analyze data related to the performance and usage of Power BI content
- Deployment Pipelines: manage and orchestrate the deployment process of Power Bl content across different environments
- Learn: access to tutorials, documentation, videos, and other educational materials to help you build your skills and knowledge in Power BI
Workspaces
Workspaces are collaborative environments (similar to a folder) where you can organize, view, share, and collaborate on content between users who also have access to that workspace.
My Workspace is your own personal sandbox. This workspace works similarly to a personal folder. Only you can access, view, and edit the content in this workspace. Here is where you can create new content or upload existing work.
Power BI Report Tour
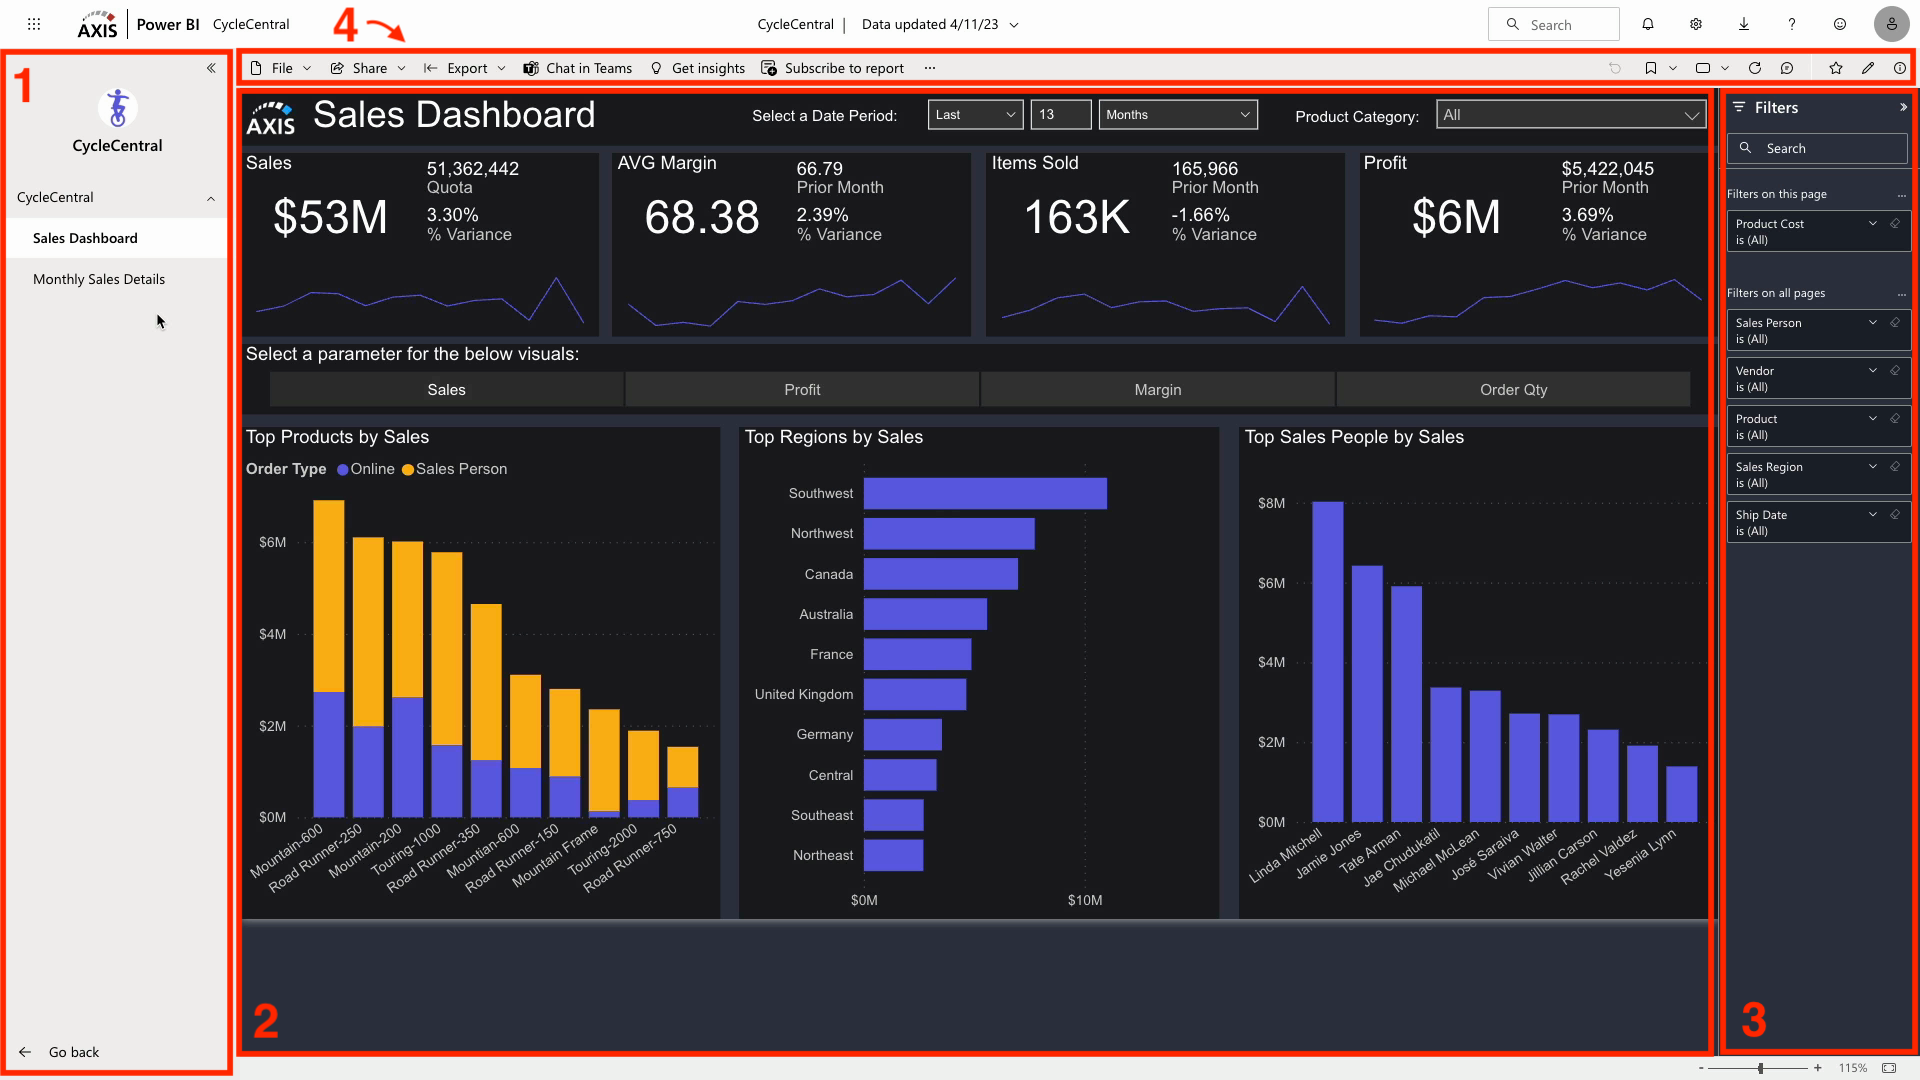
1 - Navigation Pane: sits on the left side of the report canvas and allows you to navigate to different pages
2 - Report Canvas: central part of the report which displays interactive graphs and tables you can use to find actionable insights
3 - Filter Pane: sits on the right side of the report canvas (if the report's developer decided to include it) and lets you filter your data down to answer more specific questions. To open or close the filter pane, click anywhere on the arrows or the word "Filters"
4 - Action Bar: shows actions you can take on the open report/application
Action bar
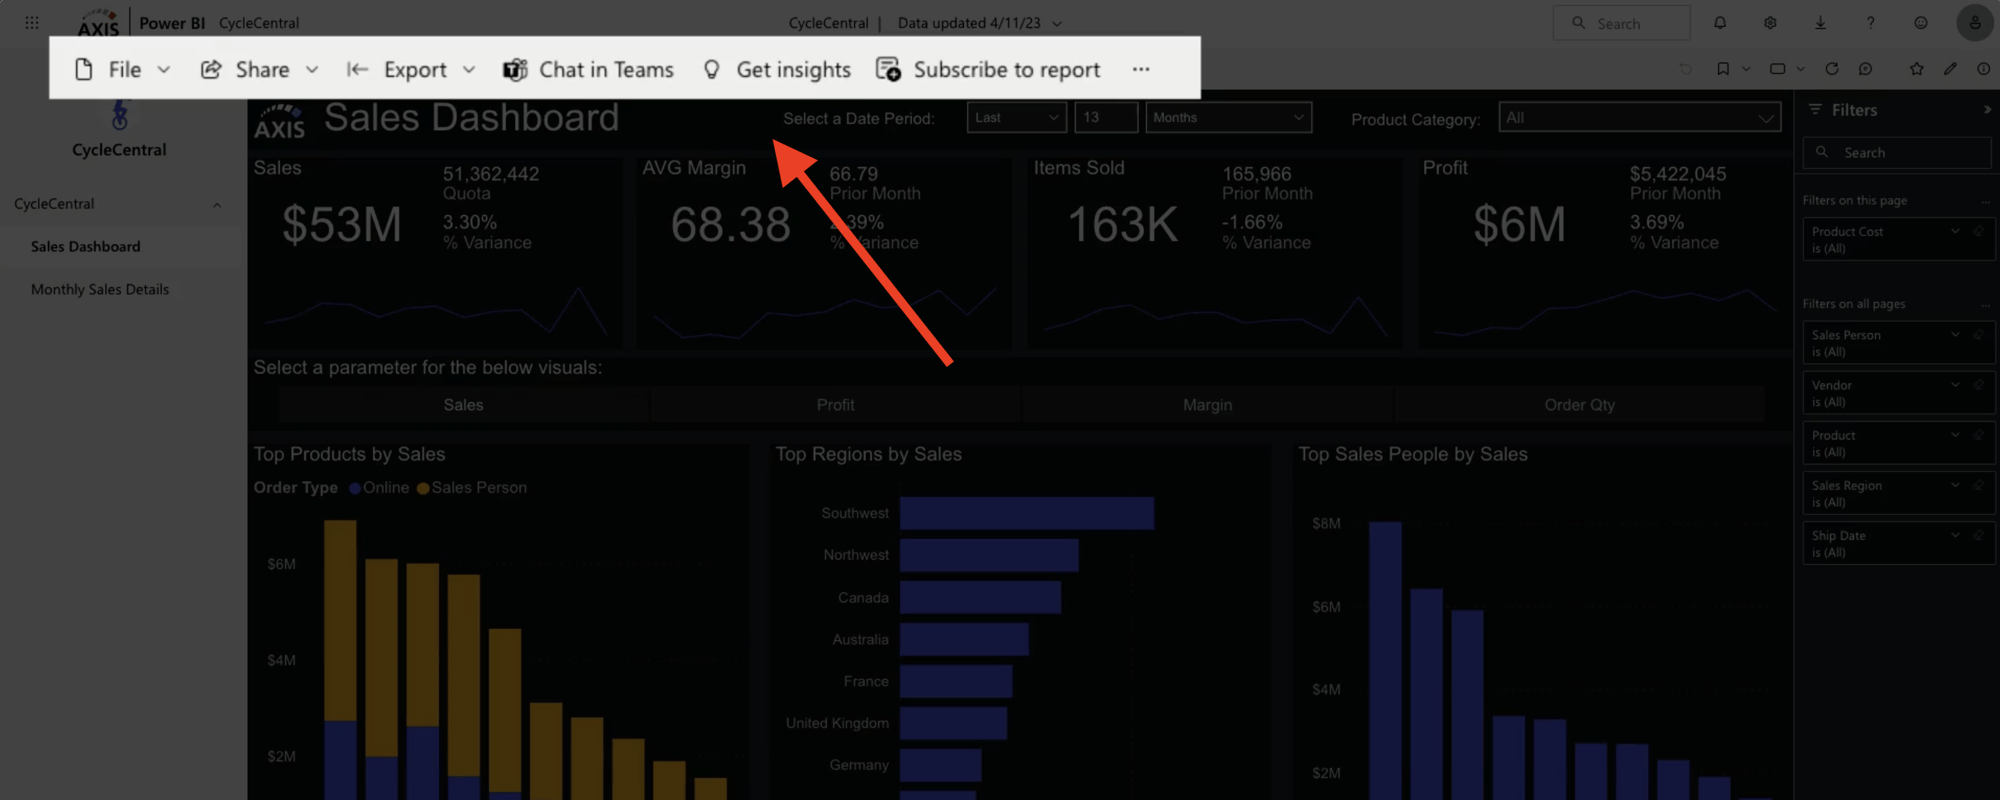
Below the Service Banner is the Action Bar, which shows actions you can take on the report/content you have open.
Note that the actions you see might be different depending on your role at the company.
Left side of action bar
- File: gives you common options like printing and embedding a Power BI report live in SharePoint
- Share: lets you send the report to others in your organization
- Export: gives you several ways to export and share data to Excel, PowerPoint, or PDF
- Chat in Teams: will pull up a Microsoft Teams channel so you can start a conversation about a report with your colleagues (see commenting section to see how you can chat directly in your report)
- Get Insights: designed to use Al to uncover helpful observations from a report
- Subscribe to Report: allows you to set up a scheduled email to stay up to date on the report.
Right side of action bar
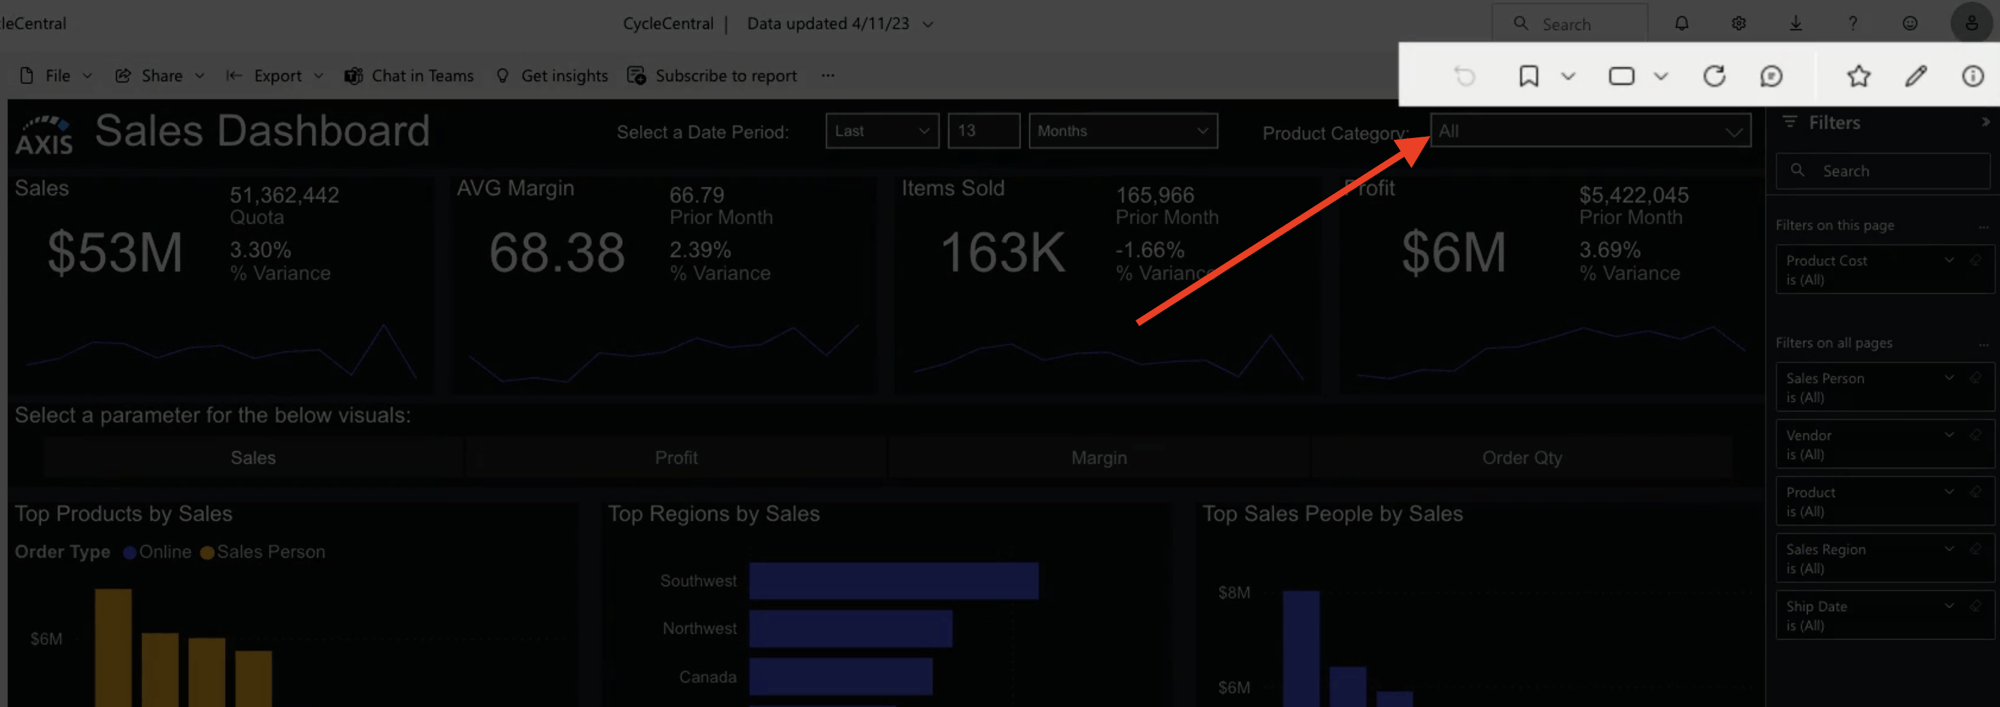
Reset your report to default
The first icon on the right side of the action bar is the reset button. This clears out all applied slicers and filters and brings the report back to its default state--the state determined by the report designer. This button will be greyed out until the report has changed from the default state.
*Note that sometimes the default state of a report will already have filters or slicers applied to it
Bookmarks
The next icon gives you access to report and personal bookmarks. After opening the bookmarks icon, select "Show more bookmarks" to open the Bookmarks pane where all your bookmarks can be accessed.
Report Bookmarks: saved states of a report (specific filters, selections, slicers, etc.) created by the report's developer that caters to a larger audience for all users to see.
Personal Bookmarks: saved states of a report that you create. You are the only user who can see them and they cannot be sent to colleagues. You are limited to 20 personal bookmarks in a single report.
Creating a personal bookmark
When you create a bookmark, the following elements are saved with the bookmark:
-
- The current page
- Filters
- Slicers, including slicer type (for example, dropdown or list) and slicer state
- Visual selection state (such as cross-highlight filters)
- Sort order
- Drill location
Once these elements are set to your desired state, select Add a personal bookmark from the bookmark icon or from the bookmarks pane.
Commenting
Commenting is a great way to collaborate with your colleagues about a report. You can either comment on full report findings or specific visuals.
The Comment button on the right side of the action bar opens the Comment Pane, where you can see previous comments and start new comment threads. Using the same "@" convention used in other Microsoft products, tag people or groups to notify them of your report findings.
*Note: comments are limited to 2000 characters
Start a new comment thread
Starting a new comment thread saves the state of the report when created. All selections, filters, and slicers are saved at the time the comment is posted.
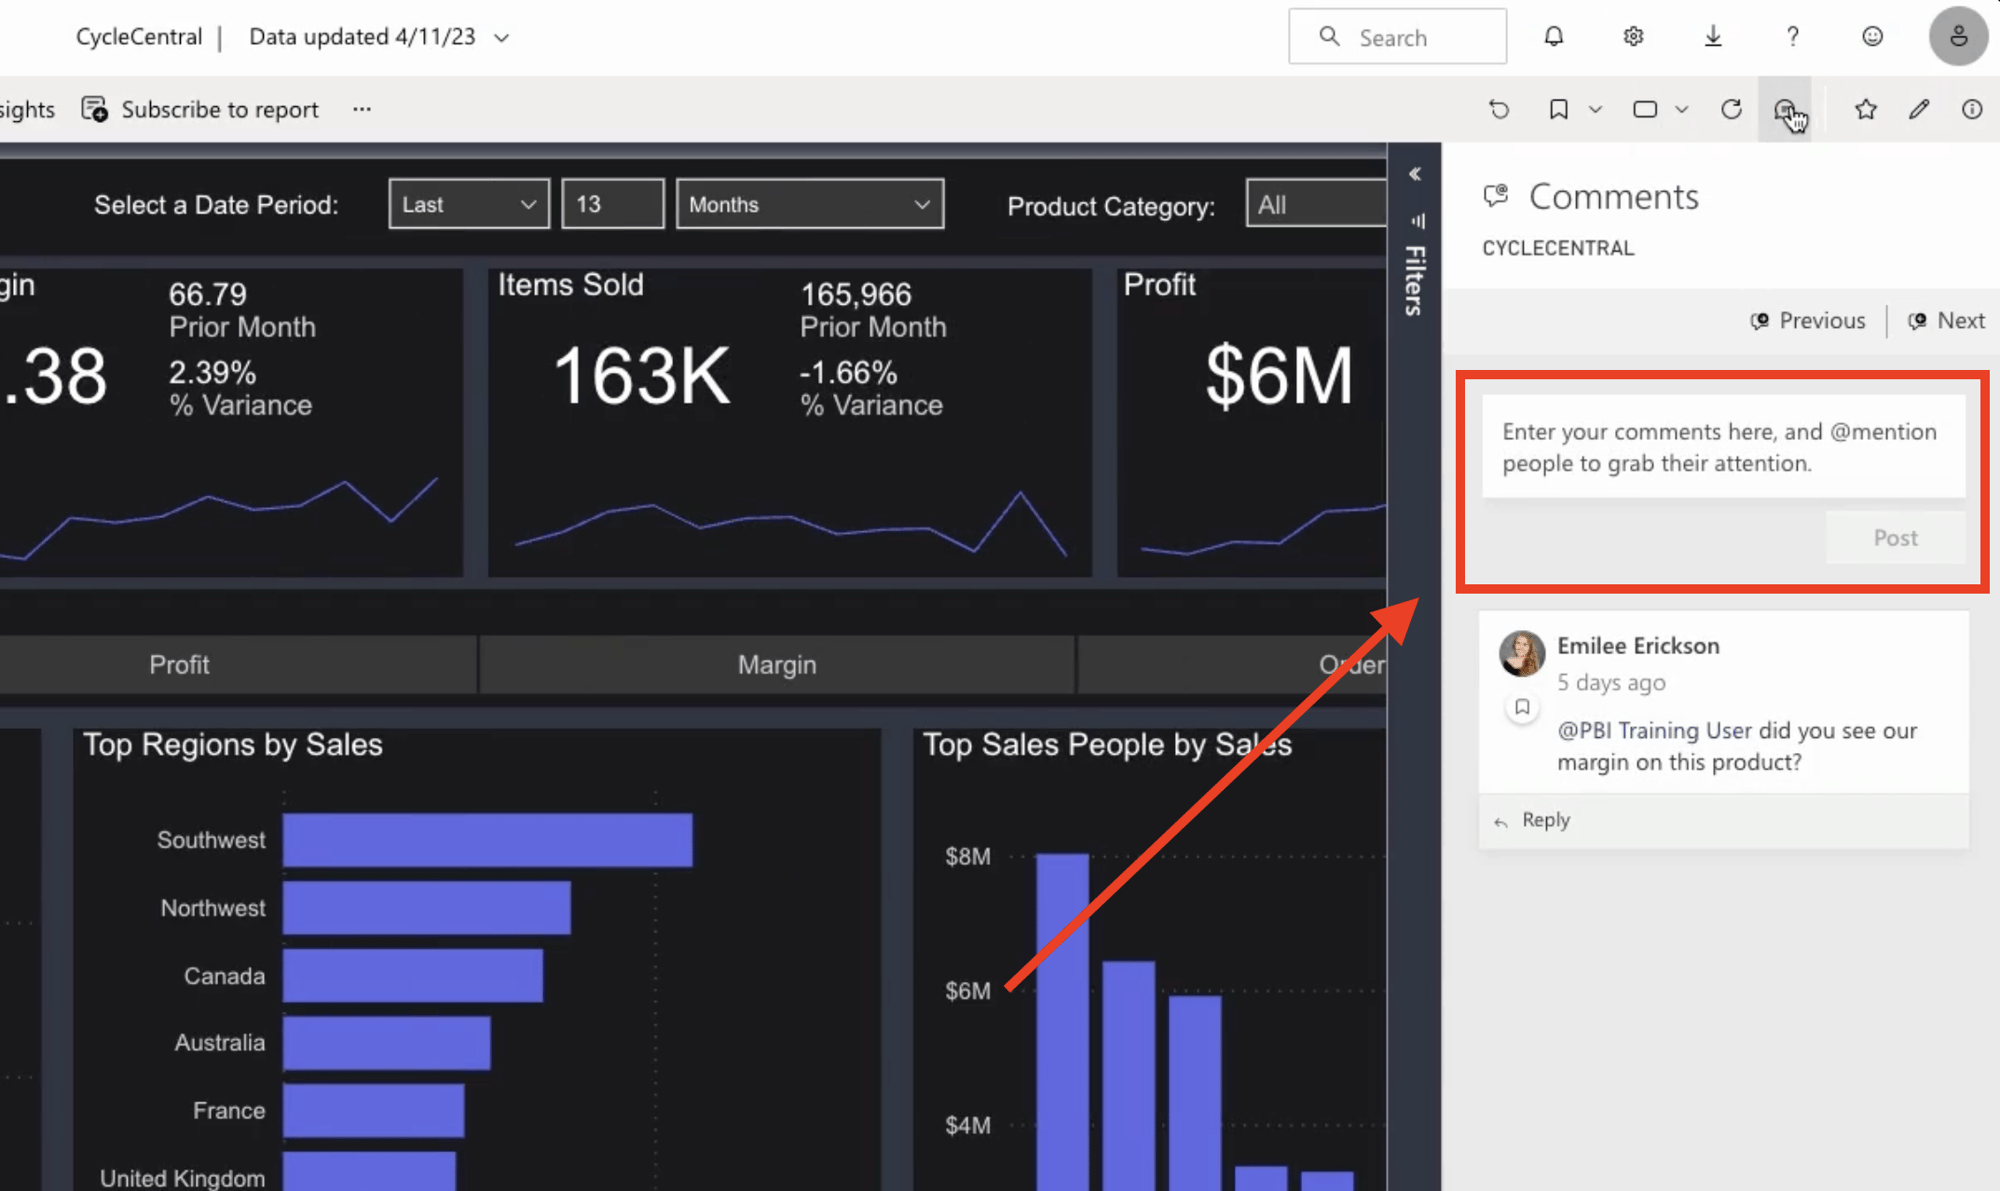
Reply to comments
Of course, you can also reply to comments others have made.
Header Icons
When you hover over most visualizations, you'll see header icons appear at the top right portion of that visual that let you take various actions.
* Note that you may see different icons appear when you hover over different visualizations.
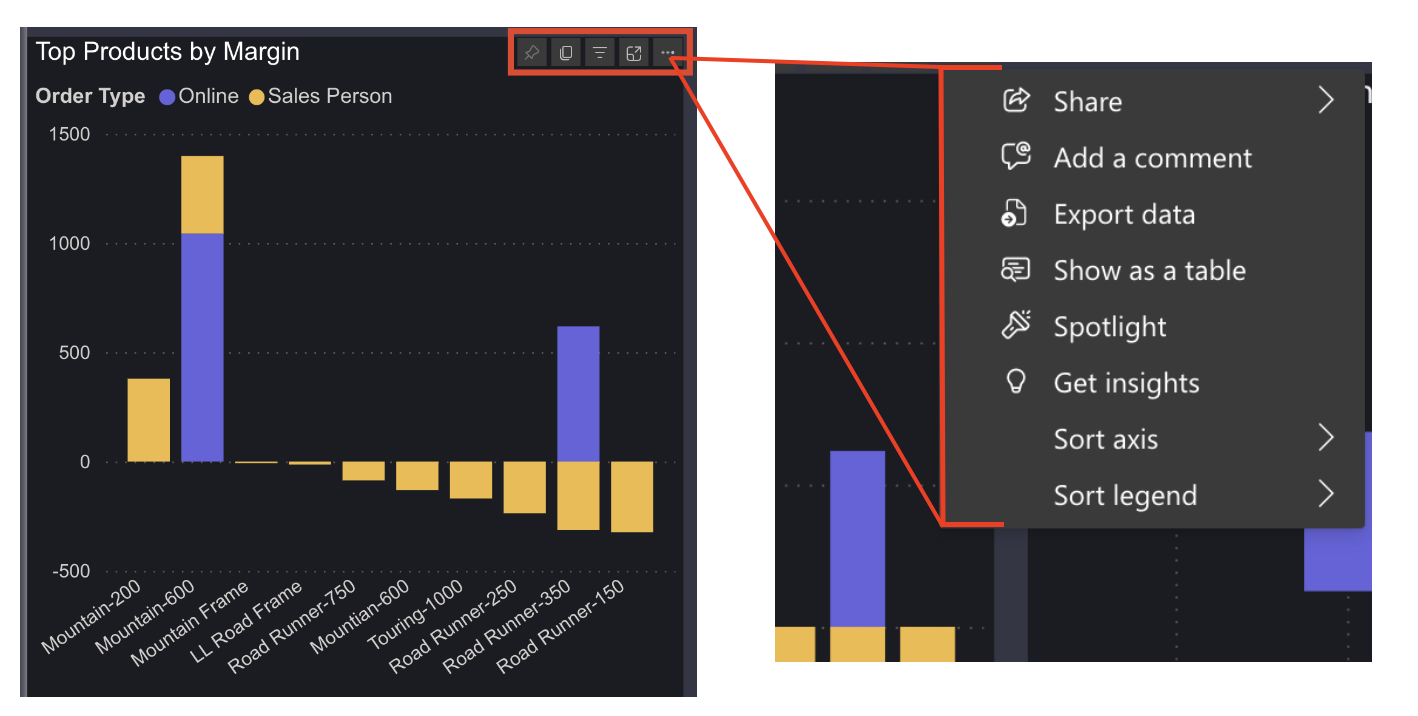
Pin icon: pin the visual to a dashboard
Clipboard icon: copy a graph or chart as a static image to paste into a message or email
Filter icon: shows what selections and filters are impacting the visualization
Focus mode: zoom a graph or chart to full screen
Key tools under the ellipsis (overflow menu)
Export data: export the data contained in a single visual
Show as table: zoom a visual to full screen and see underlying data in a table below
Spotlight: highlights the specific visual and dims the page around it for presentation purposes
Get insights: uses AI to generate data-driven insights and recommendations based on the data in a visual
